
Building Reproducible Analytical Pipelines
Master of Data Science, University of Luxembourg - 2025
Introduction

This is the 2025 edition of the course. If you’re looking for the 2024 edition, you can click here
What’s new:
- Focus on Nix as the canonical tool for reproducibility and build automation
- Integration of LLMs as an additional tool in the reproducers toolbox.
This course is based on my book titled Building Reproducible Analytical Pipelines with R. This course focuses only on certain aspects that are discussed in greater detail in the book.
Schedule
- 2025/09/04 - 4 hours,
- 2025/09/11 - 4 hours,
- 2025/09/14 - 4 hours,
- 2025/09/02 - 4 hours,
- 2025/09/05 - 2 hours,
- 2025/09/09 - 5 hours,
- 2025/09/16 - 4 hours,
- 2025/09/19 - 3 hours,
Reproducible analytical pipelines?
This course is my take on setting up code that results in some data product. This code has to be reproducible, documented and production ready. Not my original idea, but introduced by the UK’s Analysis Function.
The basic idea of a reproducible analytical pipeline (RAP) is to have code that always produces the same result when run, whatever this result might be. This is obviously crucial in research and science, but this is also the case in businesses that deal with data science/data-driven decision making etc.
A well documented RAP avoids a lot of headache and is usually re-usable for other projects as well.
Data products?
In this course each of you will develop a data product. A data product is anything that requires data as an input. This can be a very simple report in PDF or Word format or a complex web app. This website is actually also a data product, which I made using the R programming language. In this course we will not focus too much on how to create automated reports or web apps (but I’ll give an introduction to these, don’t worry) but our focus will be on how to set up a pipeline that results in these data products in a reproducible way.
Machine learning?
No, being a master in machine learning is not enough to become a data scientist. Actually, the older I get, the more I think that machine learning is almost optional. What is not optional is knowing how:
- to write, test, and properly document code;
- to acquire (reading in data can be tricky!) and clean data;
- to work inside the Linux terminal/command line interface;
- to use Git, Docker for Dev(Git)Ops;
- the Internet works (what’s a firewall? what’s a reverse proxy? what’s a domain name? etc, etc…);
But what about machine learning? Well, depending what you’ll end up doing, you might indeed focus a lot on machine learning and/or statistical modeling. That being said, in practice, it is very often much more efficient to let some automl algorithm figure out the best hyperparameters of a XGBoost model and simply use that, at least as a starting point (but good luck improving upon automl…). What matters, is that the data you’re feeding to your model is clean, that your analysis is sensible, and most importantly, that it could be understood by someone taking over (imagine you get sick) and rerun with minimal effort in the future. The model here should simply be a piece that could be replaced by another model without much impact. The model is rarely central… but of course there are exceptions to this, especially in research, but every other point I’ve made still stands. It’s just that not only do you have to care about your model a lot, you also have to care about everything else.
So in this course we’re going to learn a bit of all of this. We’re going to learn how to write reusable code, learn some basics of the Linux command line, Git and Docker.
What actually is reproducibility?
A reproducible project means that this project can be rerun by anyone at 0 (or very minimal) cost. But there are different levels of reproducibility, and I will discuss this in the next section. Let’s first discuss some requirements that a project must have to be considered a RAP.
The requirements of a RAP
For something to be truly reproducible, it has to respect the following bullet points:
- Source code must obviously be available and thoroughly tested and documented (which is why we will be using Git and Github);
- All the dependencies must be easy to find and install (we are going to deal with this using dependency management tools);
- To be written with an open source programming language (nocode tools like Excel are by default non-reproducible because they can’t be used non-interactively, and which is why we are going to use the R programming language);
- The project needs to be run on an open source operating system (thankfully, we can deal with this without having to install and learn to use a new operating system, thanks to Docker);
- Data and the paper/report need obviously to be accessible as well, if not publicly as is the case for research, then within your company.
Also, reproducibility is on a continuum, and depending on the constraints you face your project can be “not very reproducible” to “totally reproducible”. Let’s consider the following list of anything that can influence how reproducible your project truly is:
- Version of the programming language used;
- Versions of the packages/libraries of said programming language used;
- Operating System, and its version;
- Versions of the underlying system libraries (which often go hand in hand with OS version, but not necessarily).
- And even the hardware architecture that you run all that software stack on.
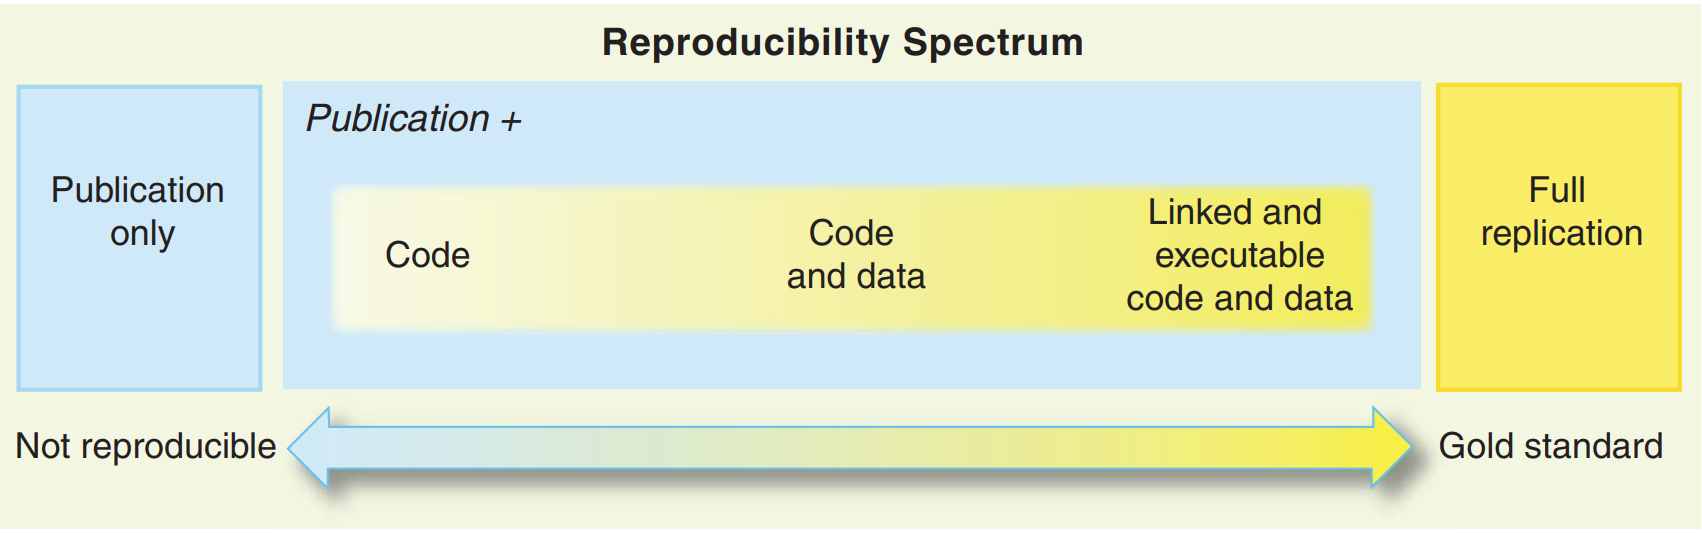
So by “reproducibility is on a continuum”, what I mean is that you could set up your project in a way that none, one, two, three, four or all of the preceding items are taken into consideration when making your project reproducible.
This is not a novel, or new idea. Peng (2011) already discussed this concept but named it the reproducibility spectrum.
Large Language Models
LLMs have rapidly become an essential powertool in the data scientist’s toolbox. But as with any powertool, beginners risk cutting their fingers if they’re not careful. So it is important to learn how to use them. This course will give you some pointers on how to integrate LLMs into your workflow.
Why R? Why not [insert your favourite programming language]
R is a domain-specific language whose domain is statistics, data analysis/science and machine learning, and as such has many built-in facilities to make handling data very efficient.
If you learn R you have access to almost 25’000 packages (as of June 2025, including both CRAN and Bioconductor packages) to:
- clean data (see:
{dplyr},{tidyr},{data.table}…); - work with medium and big data (see:
{arrow},{sparklyr}…); - visualize data (see:
{ggplot2},{plotly},{echarts4r}…); - do literate programming (using Rmarkdown or Quarto, you can write books, documents even create a website);
- do functional programming (see:
{purrr}…); - call other languages from R (see:
{reticulate}to call Python from R); - do machine learning and AI (see:
{tidymodels},{tensorflow},{keras}…) - create webapps (see:
{shiny}…) - domain specific statistics/machine learning (see CRAN Task Views for an exhaustive list);
- and more
It’s not just about what the packages provide: installing R and its packages and dependencies is rarely frustrating, which is not the case with Python (Python 2 vs Python 3, pip vs conda, pyenv vs venv vs uv, …, dependency hell is a real place full of snakes)
That doesn’t mean that R does not have any issues. Quite the contrary, R sometimes behaves in seemingly truly bizarre ways (as an example, try running nchar("1000000000") and then nchar(1000000000) and try to make sense of it). To know more about such bizarre behaviour, I recommend you read The R Inferno (linked at the end of this chapter). So, yes, R is far from perfect, but it sucks less than the alternatives (again, in my absolutely objective opinion).
That being said, the reality of data science is that the future is becoming more and more polyglot. Data products are evermore complex, and necessity are built using many languages; so ideally we would like to find a way to use whatever tool is best fit for the job at hand. Sometimes it can be R, sometimes Python, sometimes shell scripts, or any other language. This is where Nix will help us.
Nix
Nix is a package manager for Linux distributions, macOS and it even works on Windows if you enable WSL2. What’s a package manager? If you’re not a Linux user, you may not be aware. Let me explain it this way: in R, if you want to install a package to provide some functionality not included with a vanilla installation of R, you’d run this:
install.packages("dplyr")It turns out that Linux distributions, like Ubuntu for example, work in a similar way, but for software that you’d usually install using an installer (at least on Windows). For example you could install Firefox on Ubuntu using:
sudo apt-get install firefox(there’s also graphical interfaces that make this process “more user-friendly”). In Linux jargon, packages are simply what we call software (or I guess it’s all “apps” these days). These packages get downloaded from so-called repositories (think of CRAN, the repository of R packages, or Pypi, in the case of Python) but for any type of software that you might need to make your computer work: web browsers, office suites, multimedia software and so on.
So Nix is just another package manager that you can use to install software.
But what interests us is not using Nix to install Firefox, but instead to install R, Python and the R and Python packages that we require for our analysis. But why use Nix instead of the usual ways to install software on our operating systems?
The first thing that you should know is that Nix’s repository, nixpkgs, is huge. Humongously huge. As I’m writing these lines, there’s more than 120’000 pieces of software available, and the entirety of CRAN and Bioconductor is also available through nixpkgs. So instead of installing R as you usually do and then use install.packages() to install packages, you could use Nix to handle everything. But still, why use Nix at all?
Nix has an interesting feature: using Nix, it is possible to install software in (relatively) isolated environments. So using Nix, you can install as many versions of R and R packages that you need. Suppose that you start working on a new project. As you start the project, with Nix, you would install a project-specific version of R and R packages that you would only use for that particular project. If you switch projects, you’d switch versions of R and R packages.
Pre-requisites
I will assume basic programming knowledge, and not much more. Ideally you’ll be following this course from a Linux machine, but if you’re macOS, that’s fine as well. On Windows, you will have to set up WSL2 to follow along.
Grading
The way grading works in this course is as follows: during lecture hours you will follow along. At home, you’ll be working on setting up your own pipeline. For this, choose a dataset that ideally would need some cleaning and/or tweaking to be usable. We are going first to learn how to package this dataset alongside some functions to make it clean. If time allows, I’ll leave some time during lecture hours for you to work on it and ask me and your colleagues for help. At the end of the semester, I will need to download your code and get it running. The less effort this takes me, the better your score. Here is a tentative breakdown:
- Code is on github.com and the repository is documented with a Readme.md file: 5 points;
- Data and functions to run pipeline are documented and tested: 5 points;
- Every software dependency is easily installed: 5 points;
- Pipeline can be executed in one command: 5 points;
- Bonus points: pipeline is dockerized, or uses Nix, and/or uses Github Actions to run? 5 points
The way to fail this class is to write an undocumented script that only runs on your machine and expect me to debug it to get it to run.
Jargon
There’s some jargon that is helpful to know when working with R. Here’s a non-exhaustive list to get you started:
- CRAN: the Comprehensive R Archive Network. This is a curated online repository of packages and R installers. When you type
install.packages("package_name")in an R console, the package gets downloaded from there; - Library: the collection of R packages installed on your machine;
- R console: the program where the R interpreter runs;
- Posit/RStudio: Posit (named RStudio in the past) are the makers of the RStudio IDE and of the tidyverse collection of packages;
- tidyverse: a collection of packages created by Posit that offer a common language and syntax to perform any task required for data science — from reading in data, to cleaning data, up to machine learning and visualisation;
- base R: refers to a vanilla installation (and vanilla capabilities) of R. Often used to contrast a tidyverse specific approach to a problem (for example, using base R’s
lapply()in constrast to the tidyversepurrr::map()). package::function(): Functions can be accessed in several ways in R, either by loading an entire package at the start of a script withlibrary(dplyr)or by usingdplyr::select().- Function factory (sometimes adverb): a function that returns a function.
- Variable: the variable of a function (as in
xinf(x)) or the variable from statistical modeling (synonym of feature) <-vs=: in practice, you can use<-and=interchangeably. I prefer<-, but feel free to use=if you wish.
Further reading
License
This course is licensed under the WTFPL.
![]()
Peng, Roger D. 2011. “Reproducible Research in Computational Science.” Science 334 (6060): 1226–27.